 Creating graphs and charts as well as playing around with data visualization are two of the most valuable things you can do to prepare for MBA school. But if you aren’t used to dealing with data, how can you cozy up to creating charts and graphs with ease?
Here are four simple steps to becoming a data whiz in no time:
1) Google Different Graph and Chart Types
Google provides a wealth of attractive images to help you get used to all the different chart types. As you become aware of new forms, do a simple Google search to find more examples. Click on the “Images” tab to view as many different examples as you fancy.
2) Read Business Periodicals
There are many excellent business journals, magazines, and blogs that visualize data all the time. The Economist, The Wall Street Journal, BBC News, Forbes, Business Insider are just a few you can start with.
Observe which are the most common types of graphs used in these business publications. What do you notice? Be sure to take note of your favorite chart types as well. Before you know it, the insatiable urge to start creating your own graphs and charts will emerge.
3) Start Simply. VERY Simply!
Open an Excel document and create a very simple chart. Pick something you can quantify in your house and start filling in the table accordingly. Take a survey of the different fruits in your fridge. Think of a favorite song and count how many times it mentions different key words. Graph how many male vs. female family members you have.

Once you make a table, see how many different ways you can represent the data. Try different charts and see which one is the most effective way of illustrating your information.
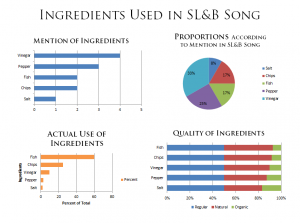
For your viewing pleasure, I included this example. I took note of how many times certain words were mentioned in the song “Fish and Chips and Vinegar” as performed by Sharon Lois and Bram. I was so proud of my creation that I sent this image to my siblings when it was finished. I’m not sure they appreciated the ingenious humor of it as much as I did, but no matter.
4) Keep Paying Attention
The simple act of making charts and graphs will heighten your awareness of the data all around you. As you go throughout your day, think of how much information surrounds you that could be graphed. Keep a running list of these data points and start graphing them. Pretty soon, you will have an attractive portfolio of graphs and charts at your disposal.
A final word of caution: Once you master the skill, thinking in terms of graphs and charts may start to become somewhat of an addiction. When your friends start to call you a huge nerd, you know you’re on your way to becoming a true data whiz.