Birth rates are important statistics for economists to keep their eyes on. As worldwide birthrates have fallen in most countries, this brings up a number of economic concerns. When the birthrate falls below what is considered to be a healthy replenishing level, all kinds of things can go wrong.
The strict definition of birth rate is “the number of births per thousand of population per year”. Statisticians usually only count the number of live births, or infants that survive pregnancy and birth. In some reports, however, birth rate is calculated as the average number of children per couple.
If no children ever died in pregnancy or child birth, the ideal level for reconstituting the population would be 2 children per couple. In reality, the number is somewhere closer to 2.2, where the US had remained for a while.
Populations in Decline
There has been much talk about European populations being in a state of decline. From all this talk I have heard that the US is still doing reasonably well. In the 90’s the average birth rate was 2.2 children per couple.
Sadly, this is no longer the case for the US. Birth rates are dropping in all 50 states just as they are throughout Europe.
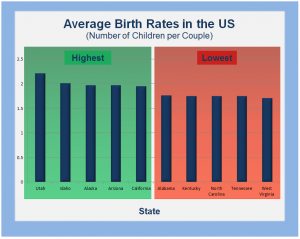
Some time ago I accessed public records of birth rates in the US. Out of curiosity, I made a graph of the data. What I found was surprising.
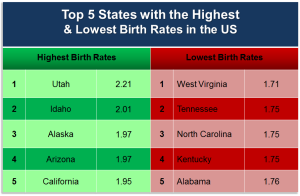
Top 5 States with the Highest & Lowest Birth Rates

Before analyzing the data, I had guessed that Utah would be the state with the highest birth rate. I was gratified on this occasion to be right. As a Mormon, I knew how much childbearing and raising is emphasized in the Utah LDS culture. Since there are so many Mormons in Idaho, I didn’t find it surprising that Idaho was the #2 state with the highest birth rate.
The top 5 states with the highest birth rates were all in the Western region of the US. The top 5 states with the lowest birth rates were all Eastern states. This isn’t entirely surprising, except that the states with low birth rates are in the South. I would have thought the Northeastern states would have had lower birth rates, but this just shows what I know.
Mind Blown

What was most astonishing to me was how little difference there was across all 50 states. I had guessed Utah would be the state with the highest birth rate, which is true–but not by a large margin. West Virginia had the lowest birth rate, but again, not by much.
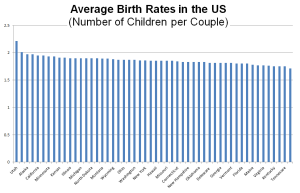
This implies that the decline in birthrate is consistent across all 50 states. It is slightly more pronounced in some states than others. However, when you round to the nearest whole number, every state comes out with an average birth rate of 2. The actual US average is 1.86, below the ideal replenishing level.
It looks rather ridiculous to graph all 50 states, but when you do, you realize how small the differences are amongst al the birth rates in the US.
 Conclusions
From these data we can see that the sub par birth rate is consistent across all 50 states–including Utah and Idaho. The US is officially in a state of decline in terms of birth rate.
Some statisticians argue that the United States is okay despite its low average birth rate. A steady influx of immigrants keeps the population restocked at level that haven’t seemed to alarm economists yet. But can immigration take really the place of a healthy birth rate level?